IT. OT. AI.Your Infrastructure, Agentic AI, Compute, Factory, Enterprise, Supply Chain, Plant Floor, Workforce, or Multicloud is a living graph. Run it like one.
TwinGraph is the live graph server built to do so.
Your systems, your AI agents, and your data all depend on each other but nothing in your stack actually knows it. TwinGraph does, in real time.
You don't have an orchestration problem. You have a shape problem.
Graph databases are great for analytics, but modern operations need a system of action to bridge the gap between data and execution.
A server that hosts graphs. Graphs whose nodes are running code.
TwinGraph Server is a persistent gRPC service that hosts one or more TwinGraphs: in-memory, Rust-powered graphs identified by ID. Each is composed of TwinGraphNodes: living objects that connect to data streams, call AI agents, query data stores, or invoke serverless functions in response to graph activity. The graph itself becomes the runtime.
twingraph_id. Holds the nodes and their relationships for a single system, plant, cloud, or tenant.TwinGraphNode subclass. It stores data, runs code, and reaches out to the systems it represents — data streams, data stores, serverless functions, AI Agents, APIs, and more.The protocols and services your stack already speaks.
Define nodes. Add them to the graph. They start doing work.
The lucidtc_twingraph SDK is how you talk to the server. Connect with RemoteTwinGraph, add typed nodes, and the moment they're on the graph they can stream telemetry, run agents, and call out to the systems they represent.
import lucidtc_twingraph as tg

# connect to a graph hosted on a TwinGraph Server
graph = tg.RemoteTwinGraph(
    twingraph_id="plant-kc",
    server_address="twingraph.prod:50051",
    secure_channel=True,
    auth_token=TWINGRAPH_SERVER_AUTH_TOKEN,
)

# drop a live MQTT broker onto the graph
broker = tg.MQTTBrokerNode(
    broker_host="mqtt.plant.local",
    broker_port=8883,
    use_tls=True,
    creds=MQTT_BROKER_CREDS,
)
graph.add_mqtt_broker_node(broker, auto_connect=True)

# subscribe a topic — telemetry now flows into child nodes
graph.subscribe_to_topic(
    broker_twingraph_id=broker.twingraph_id,
    topic="plant/kc/line01/machine02",
    qos=2,
)

# add a Vertex AI agent that reasons over the live graph
# note the tools the agent has access to are added as nodes as well
agent = tg.VertexAIAgentNode(
    node_id="sre-agent-01",
    project_id="my-gcp-project",
    location="us-central1",
    resource_id="2038243770011288214",
)
graph.add_twingraph_node(twingraph_node=agent)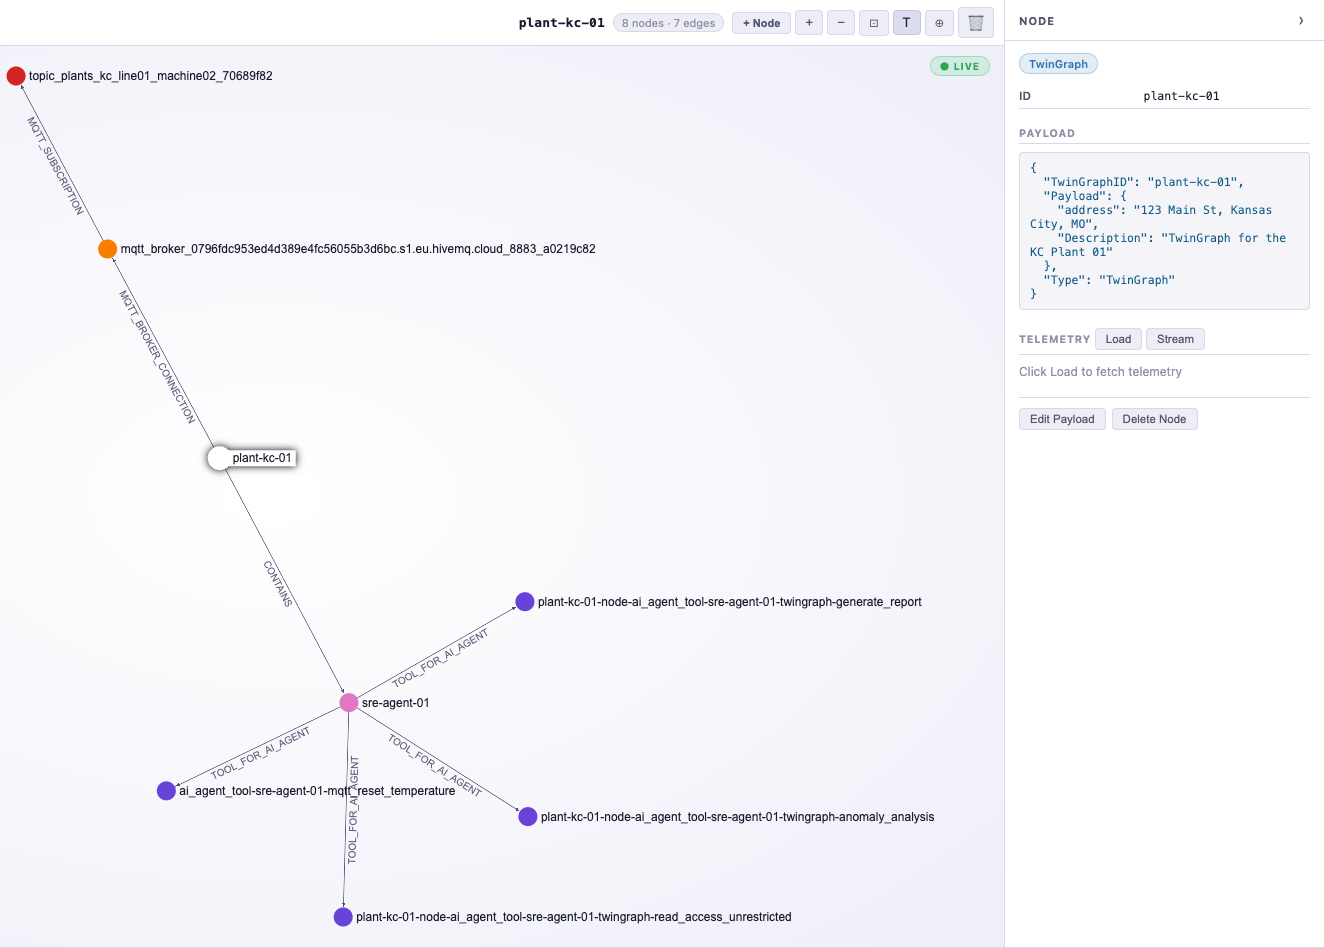
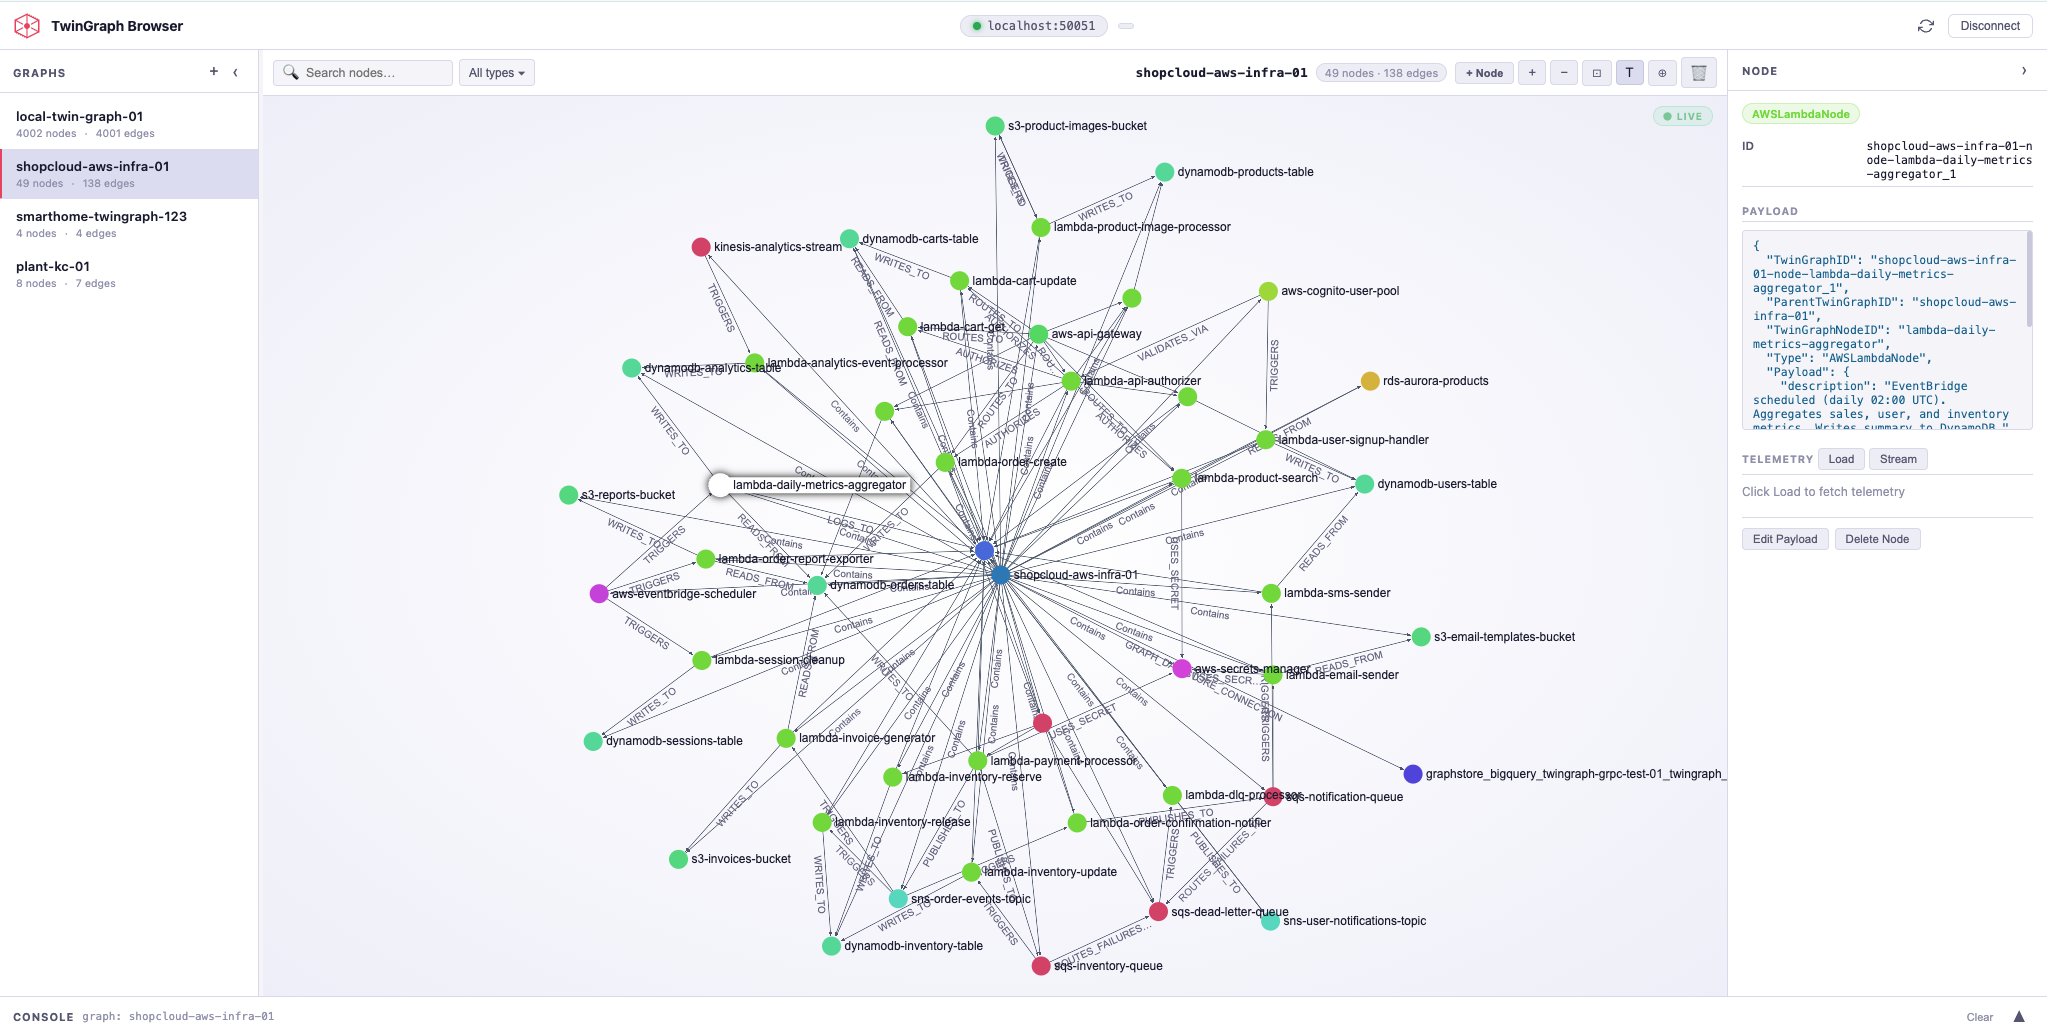
See every node, every edge, and every event in real-time.
TwinGraph Browser is a standalone management interface for your running TwinGraph Server. Connect to any hosted or local TwinGraph Server to build and modify graphs, manage MQTT brokers and topics, inspect node state, and watch live telemetry stream through the topology. Includes an interactive graph visualization and a built-in Python console for direct server access.
Turn live operational data into decisions, automatically.
TwinGraph is the operational graph platform that connects AI, infrastructure, and industrial systems to the real-time state of your business.